macro report · June 19, 2026
OSFI Lowers the Domestic Stability Buffer to 3.0%: Why It Could Free Up More Mortgage Capital
On June 19, 2026, OSFI cut the Domestic Stability Buffer for Canada's largest banks from 3.5% to 3.0% of risk-weighted assets — its first level change since June 2023. The regulator frames it as releasing well-capitalized banks to support the economy; the reasonable inference for housing is more balance-sheet room for mortgage credit, not automatic mortgage easing.
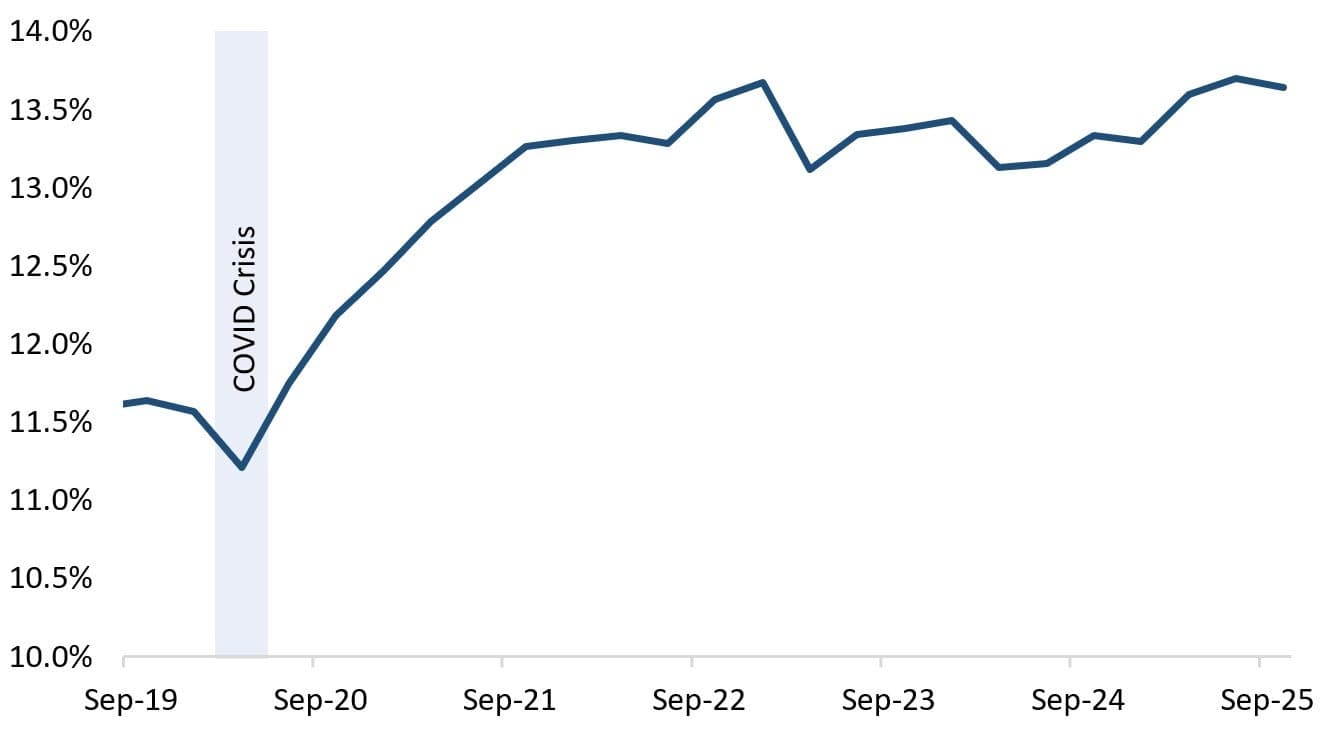
Down from 3.5% of risk-weighted assets. The supervisory CET1 expectation for Canada's largest banks falls to 11.0%; they currently average 13.5%.
Executive summary
On June 19, 2026, OSFI lowered the Domestic Stability Buffer (DSB) for Canada's domestic systemically important banks from 3.5% to 3.0% of risk-weighted assets and cut the top end of the DSB range from 4% to 3%. That reduces the supervisory Common Equity Tier 1 (CET1) expectation for the big banks to 11.0%.
OSFI's stated reason is that Canada's largest banks are already well capitalized, with an average CET1 ratio of 13.5%, and can now deploy more of that excess capital into the economy. OSFI explicitly frames the move as a way to support lending and risk-taking through a period of change in trade, geopolitics, infrastructure, defence, resources, and AI.
The mortgage implication is not stated directly by OSFI, but it is a reasonable inference. A lower capital buffer gives large banks more room to grow risk-weighted assets without raising new equity first. Since residential mortgages are a core asset class for Canadian banks, part of that added capacity could flow into mortgage originations, renewals, refinancing, warehouse lines, and construction-related credit. It does not guarantee easier mortgage credit, but it improves the system's capacity to provide it.
What changed
Why OSFI says it is comfortable cutting the buffer
OSFI's rationale is straightforward:
- The banks have remained profitable and well capitalized.
- Expected credit loss provisioning has stabilized.
- Credit growth has picked up, though still below long-run norms.
- Stress tests suggest banks can absorb significant shocks while continuing to lend.
- Broader system vulnerabilities are still elevated, but have been relatively stable.
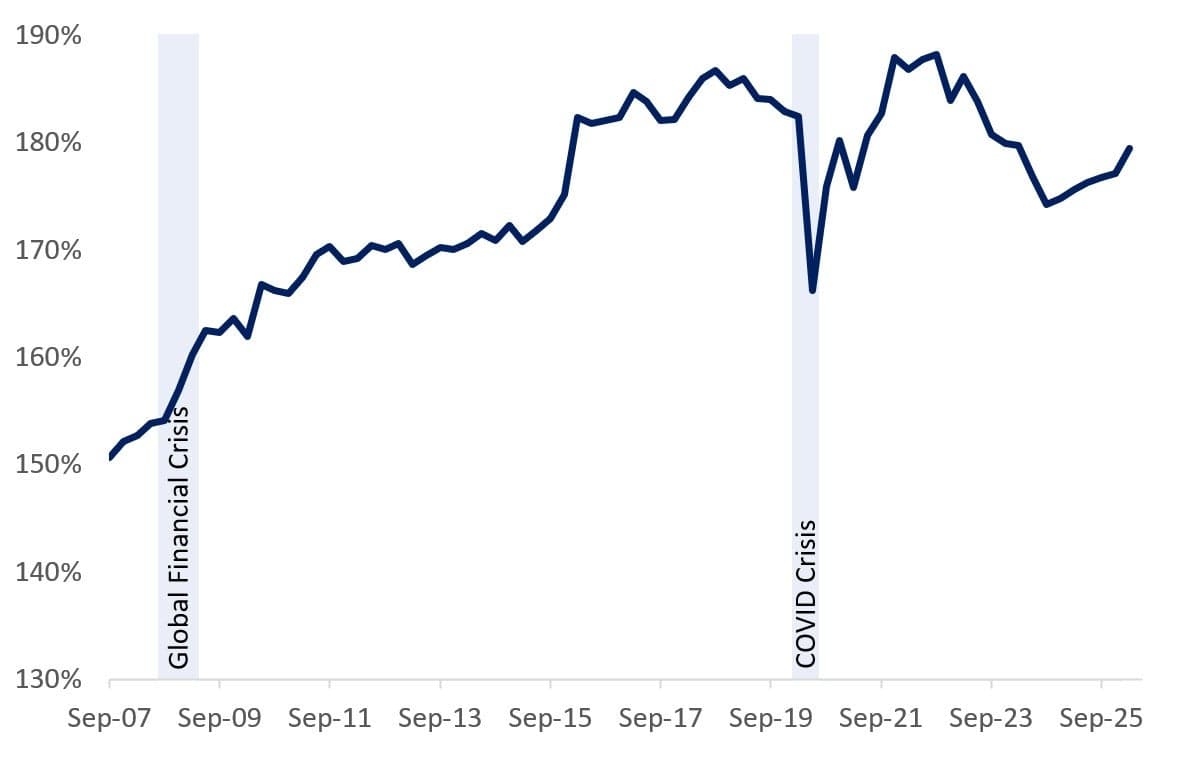
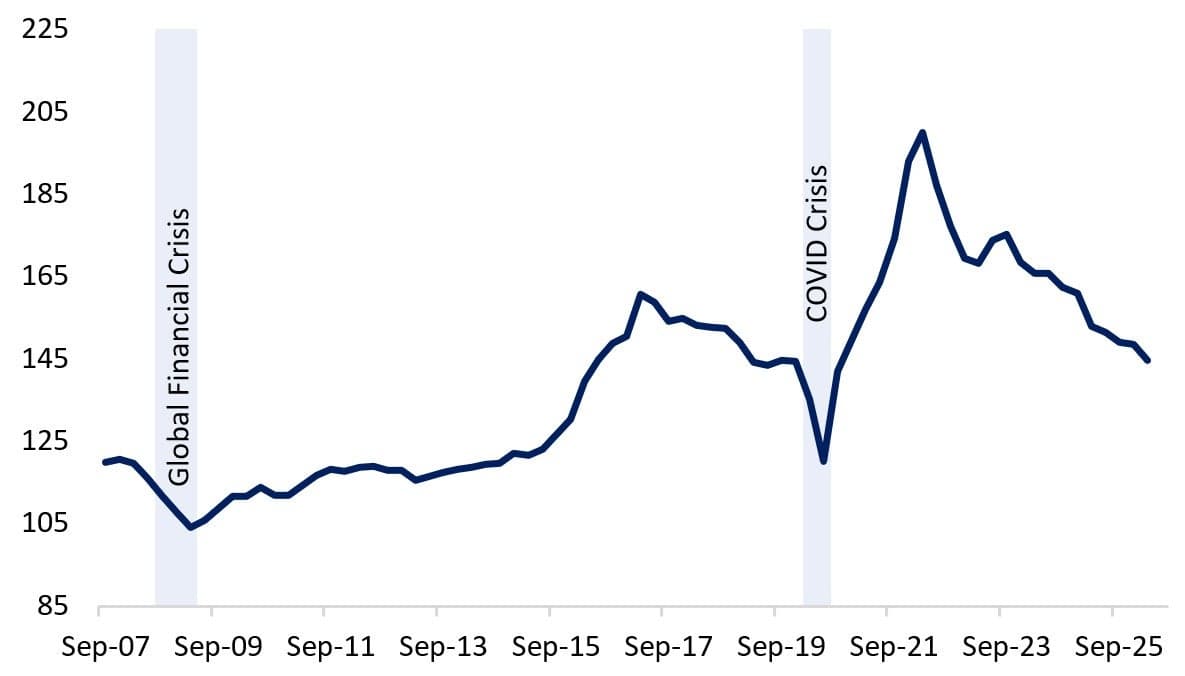
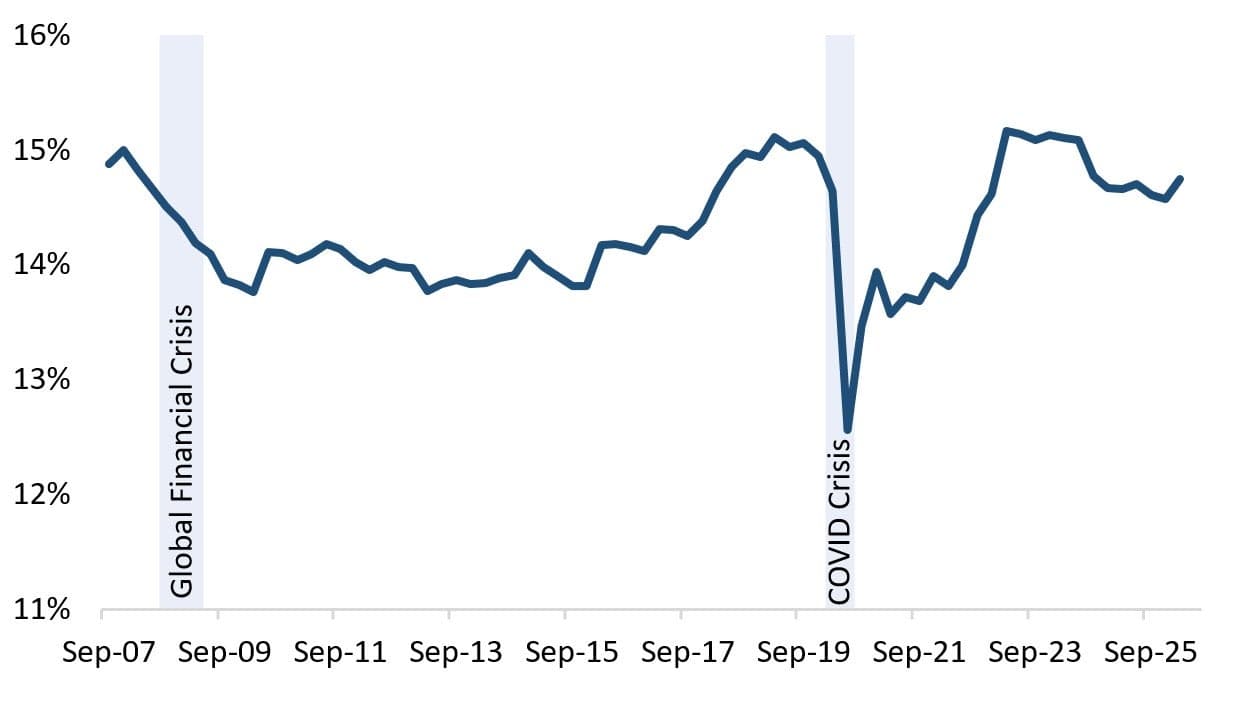
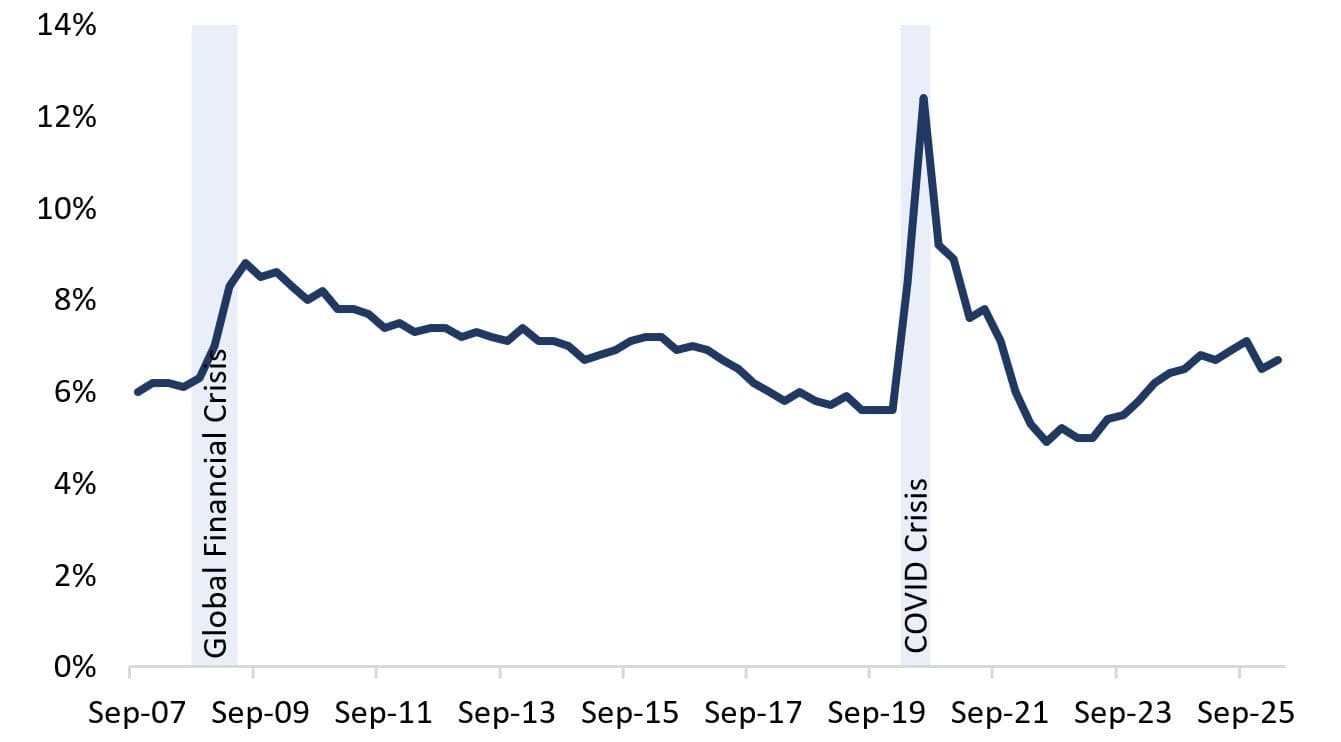
The decision note still highlights familiar Canadian vulnerabilities: household indebtedness remains high, house prices are still elevated relative to fundamentals even after cooling, and unemployment and delinquencies have risen but remain within historically normal ranges.
An inference, not an OSFI quote
The mortgage-capital argument below is an inference from OSFI's capital decision, not a direct OSFI statement. Lowering the DSB does not force banks to make more mortgages — it reduces how much CET1 they must hold against a given stock of risk-weighted assets, and capital is one of the main constraints on balance-sheet growth.
Why this could lead to more mortgage capital
In practice, a looser aggregate capital constraint can support mortgage credit in a few ways:
- More origination capacity: banks have more room to add insured and uninsured mortgage exposure before capital becomes binding.
- More renewal and refinance flexibility: lenders can keep competing for high-quality borrowers instead of preserving as much capital headroom.
- More support for housing-adjacent credit: home equity lines, builder finance, land loans, and insured multifamily lending can all benefit.
- Better pricing resilience: if capital is less scarce, banks may be less aggressive about widening spreads solely to ration balance sheet.
The most important caveat is that mortgage capital does not move only with capital rules. It also depends on funding costs, unemployment, home prices, arrears, OSFI underwriting standards, securitization conditions, and banks' internal risk appetite. So the likely effect is "more capacity to lend" rather than "automatic mortgage easing."
Real estate read-through
For housing markets, the cleanest interpretation is that OSFI is trying to preserve resilience while making sure capital rules do not unnecessarily choke off credit during a slower, more uncertain cycle.
That matters because mortgage markets usually tighten before housing weakens materially. If large banks have more room to keep lending, renew loans, and absorb demand for prime mortgage credit, that can reduce the odds of an avoidable credit crunch. It is more supportive for mortgage availability than for home prices directly, but the two are linked.
For borrowers and investors, the likely first-order effects are:
- Prime borrowers may continue to see strong competition from large-bank lenders.
- Multifamily and insured rental lending could remain better supported than feared if banks use some released capacity there.
- A softer capital constraint may help keep refinancing channels open for stronger borrowers even if the macro backdrop stays uneven.
- The move is more likely to support credit availability than to trigger a broad drop in mortgage rates by itself.
What the charts show
The decision note's chart package argues that vulnerabilities are still real, but not deteriorating fast enough to justify keeping the old, higher buffer.
1. Household leverage is still high
2. Home prices have cooled relative to income
3. Debt-service pressure remains elevated
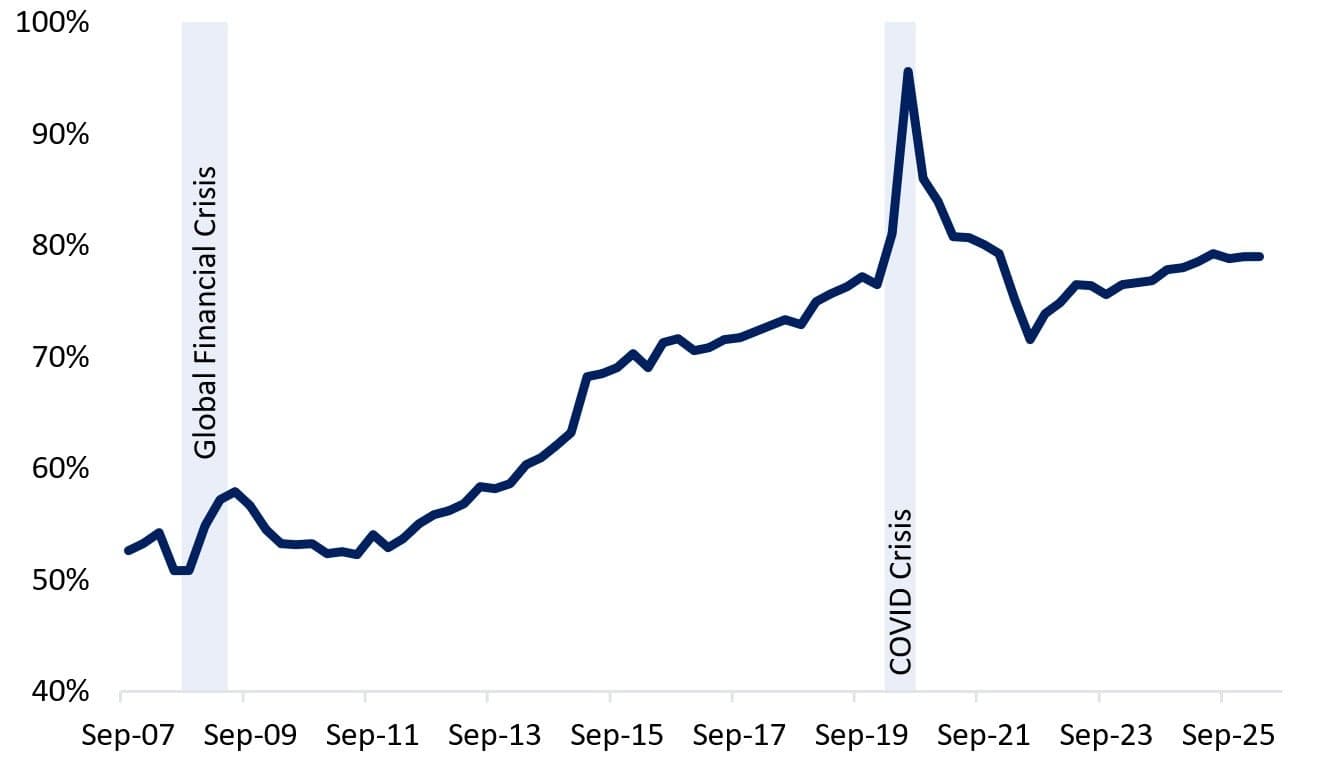
4. Corporate leverage is still a macro vulnerability
5. Geopolitics still matter
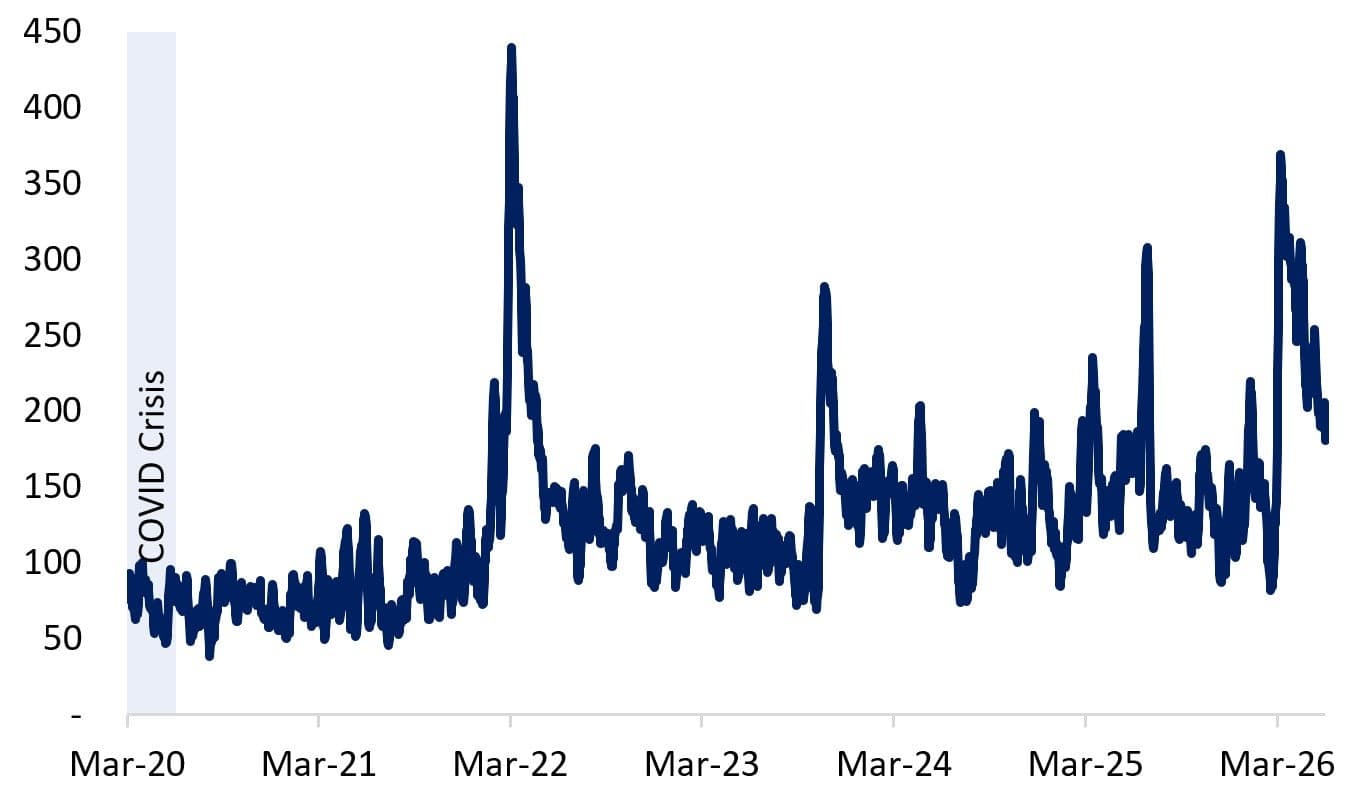
6. Trade uncertainty has cooled from the spike
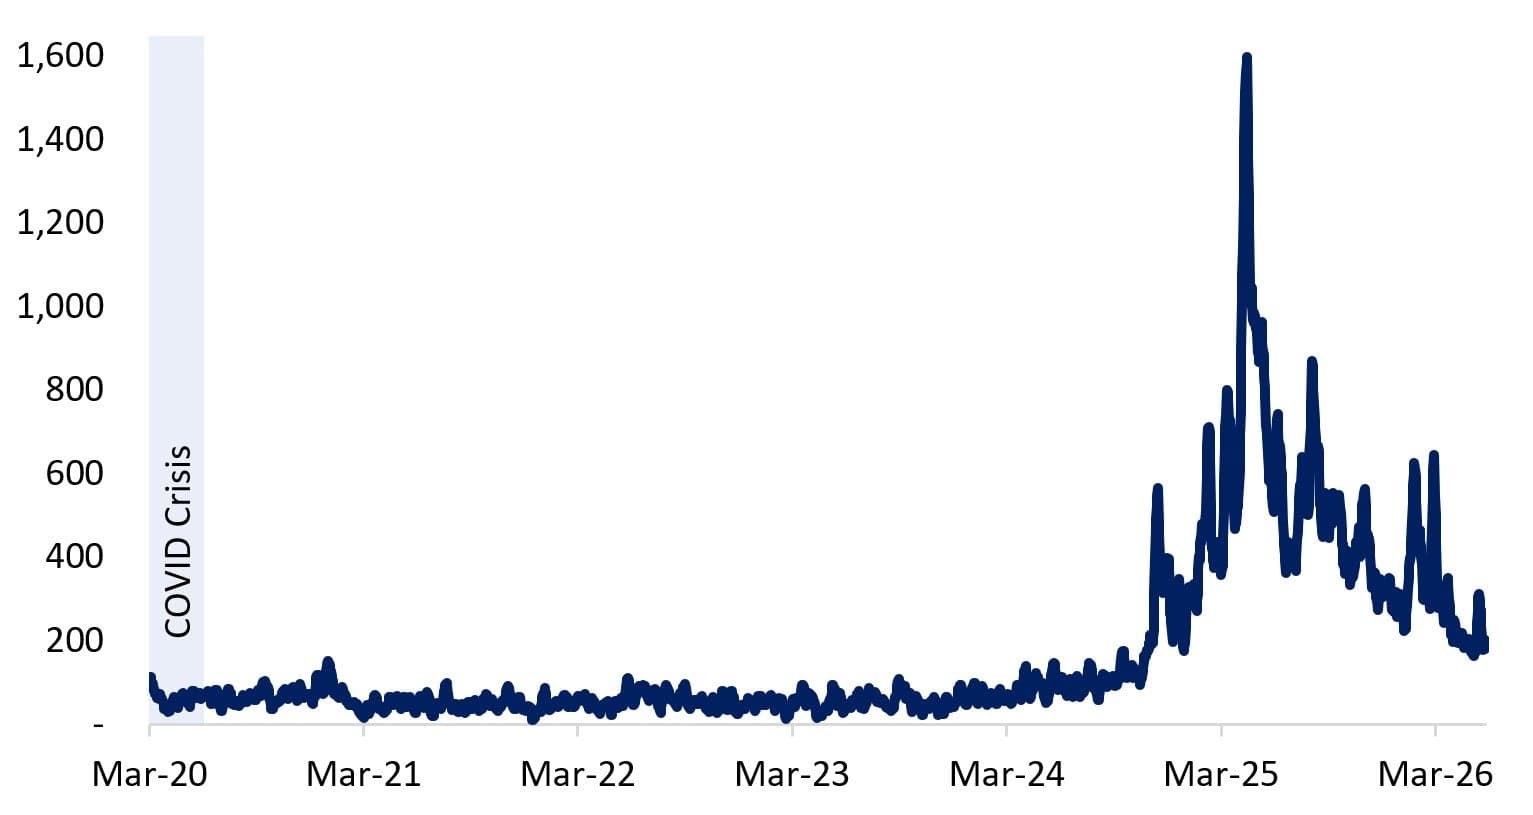
7. Bank capital levels remain comfortably above the new minimum
8. Unemployment has risen, but not to crisis levels
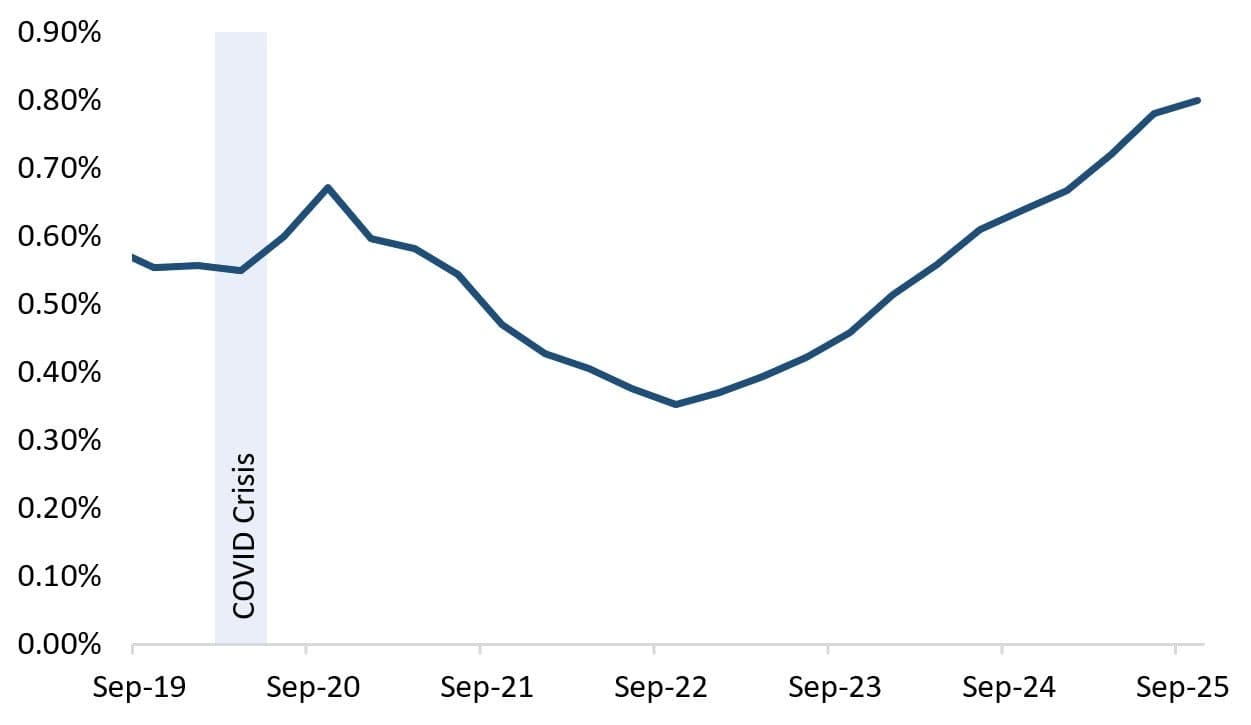
9. Loss provisioning looks contained
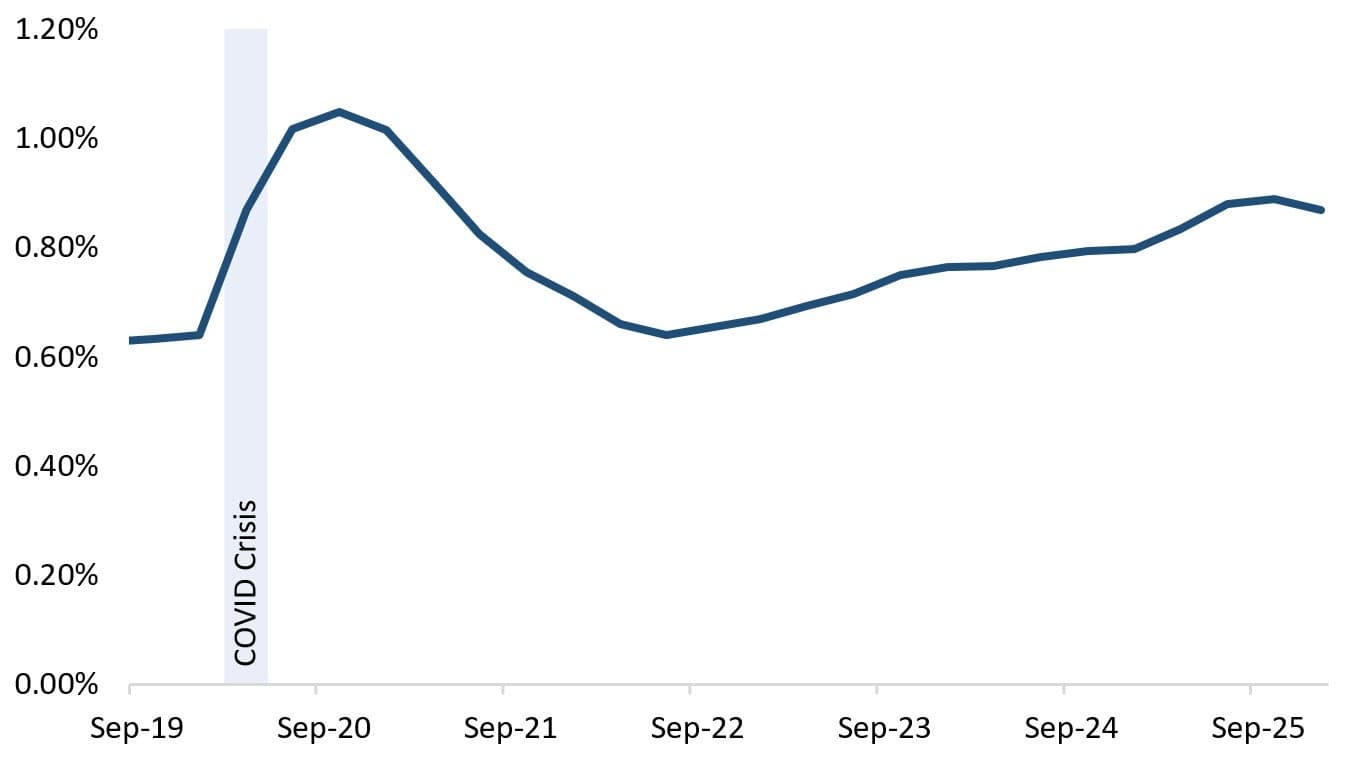
10. Impaired loans have risen, but remain manageable
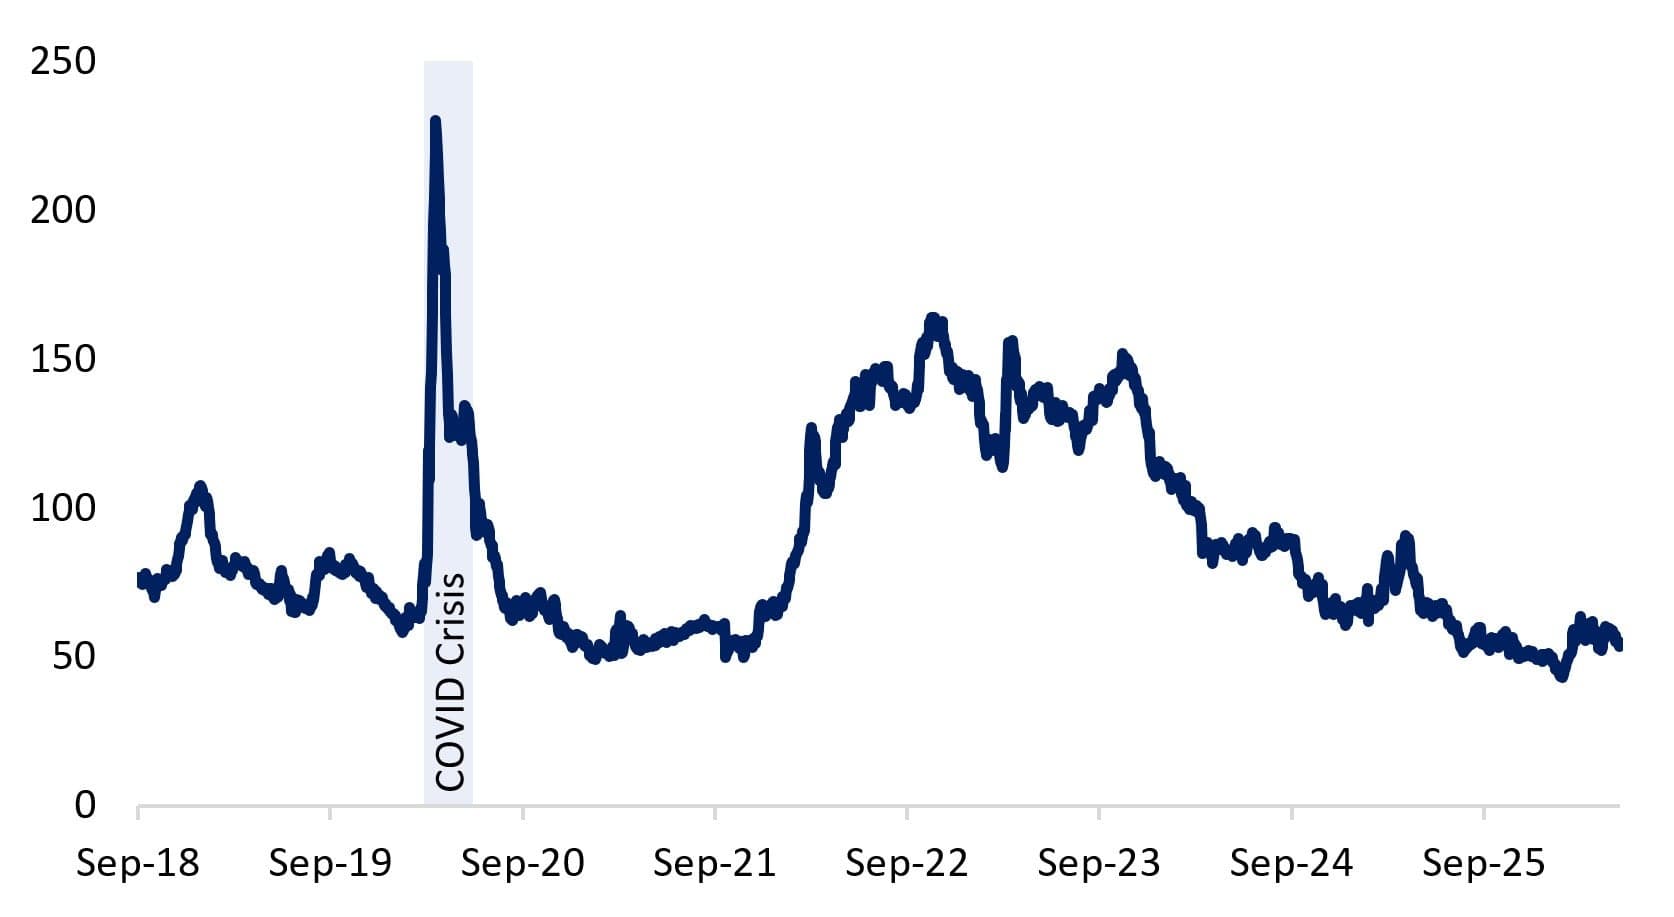
11. Funding spreads widened briefly, then eased
Bottom line
OSFI is telling the market that Canadian banks are strong enough to operate with a slightly smaller capital buffer and should use some of that excess capacity to support the economy. For housing and real estate, the practical implication is that the large banks now have somewhat more room to extend mortgage credit and adjacent housing finance without new equity needing to do as much of the work.
That does not mean a mortgage boom is coming. It means the regulatory backdrop has become modestly more supportive for mortgage capital at the margin.
Sources
- OSFI lowers Domestic Stability Buffer to 3.0% so Canada's largest banks can deploy more capital ↗— OSFI news release, June 19, 2026
- Domestic Stability Buffer decision summary note — June 2026 ↗— OSFI